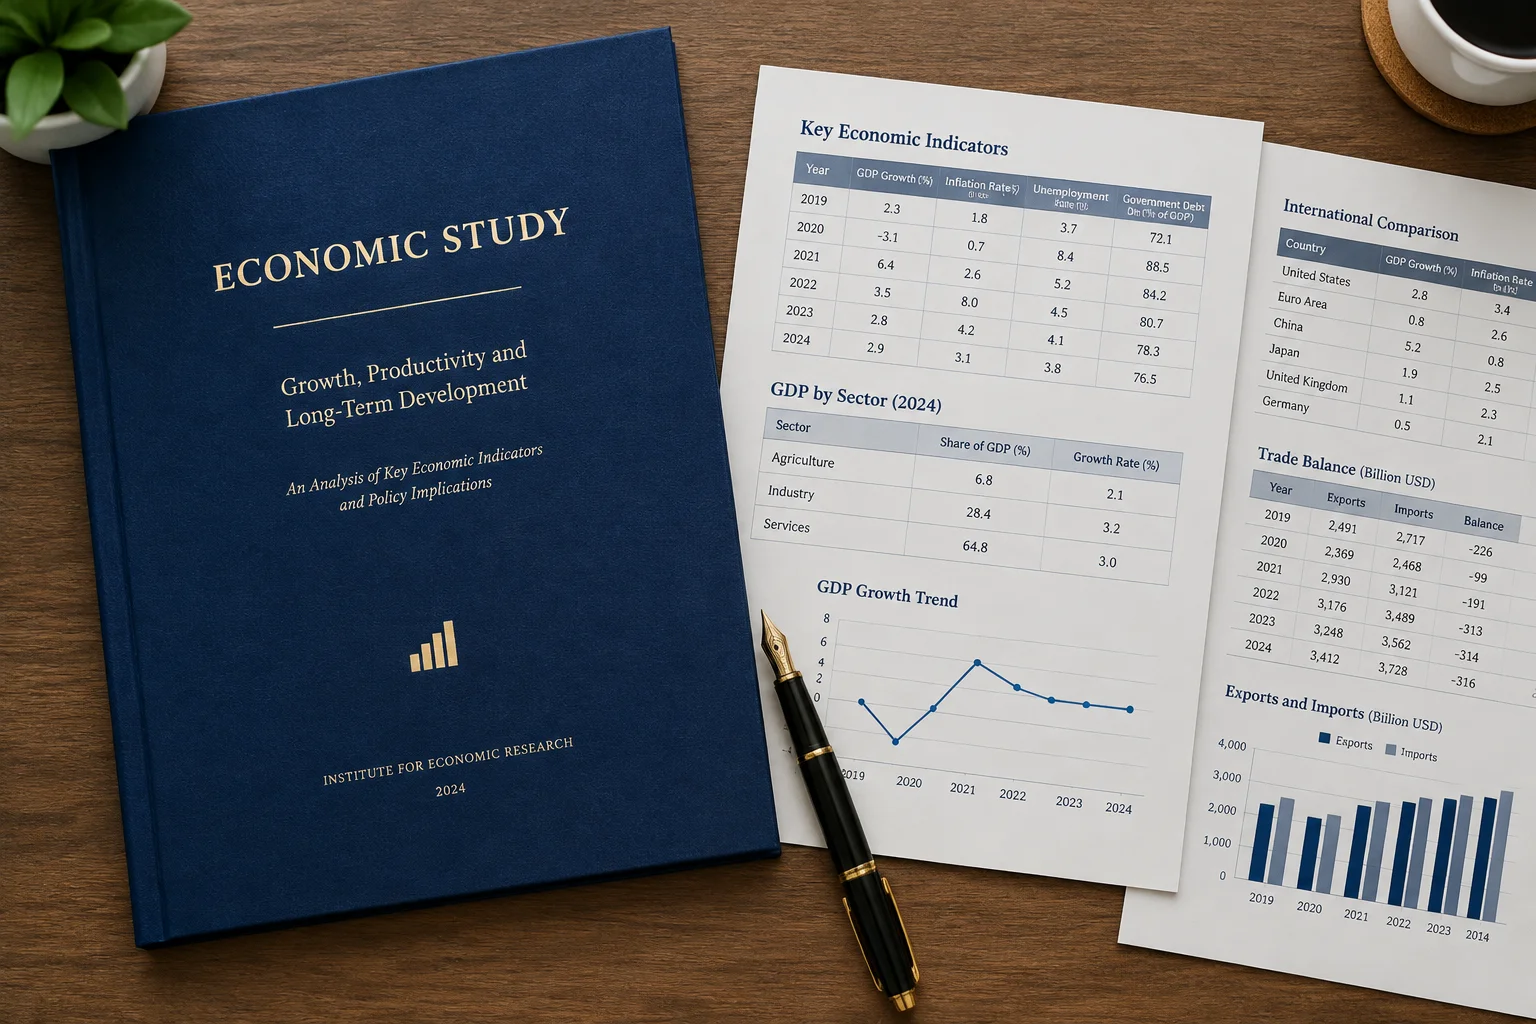

Growth Trajectory and the Upgraded 2.5% GDP Target
The Federal Reserve Bank of Philadelphia has released its third-quarter Survey of Professional Forecasters, capturing a notable recalibration in aggregate output expectations. Forecasters raised their projection for annualized real gross domestic product expansion to 2.5 percent, marking a distinct upward shift from the previous quarter's cautious estimates. This momentum draws substantive fuel from persistent consumer spending and sustained non-residential private investment in automation hardware.
Across the panel of institutional economists and academic forecasters, the variance between upper and lower quartiles has contracted considerably. The revised consensus reflects an economy expanding slightly above its long-term structural potential, dampening lingering fears of near-term stagnation while presenting central bank policymakers with a resilient macroeconomic baseline.
Labor Market Stabilization and Headline Inflation Metrics
Beneath headline production numbers, the survey documents an orderly equilibrium across national labor markets. The projected unemployment rate settles at 4.2 percent through the conclusion of 2026, pointing toward continued balance between workforce absorption and job openings. Concurrently, wage pressure indicators show steady deceleration toward levels compatible with long-run price stability goals.
This measured deceleration suggests that nominal demand is normalizing without requiring significant workforce liquidation. Sovereign yields have mirrored this expectation: expectations for the 10-year Treasury yield hold firm near 3.85 percent, indicating market participants anticipate orderly monetary transitions rather than emergency easing interventions.
Key Forecast Benchmarks & Indicators
Model Metrics| Indicator | Target Period | Baseline Estimate | Validation Status |
|---|---|---|---|
| Real GDP Growth (Annualized Rate) | Q3 2026 | 2.5% | Consensus Median |
| Headline CPI Inflation Rate | Full Year 2026 | 2.4% | Revised Lower |
| Civilian Unemployment Rate | Q4 2026 | 4.2% | Equilibrium Level |
| 10-Year Treasury Bond Yield | 2026–2027 Mean | 3.85% | Yield Curve Parity |
Cross-Model Divergence and Asymmetric Sensitivities
While baseline projections illustrate constructive stabilization, distribution metrics highlight explicit asymmetry in prospective risks. Individual survey respondents identified distinct structural variables that could trigger variance relative to the central forecast pathway:
- — Commercial credit availability tightens as regional depository institutions build balance-sheet capital buffers.
- — Productivity enhancements linked to enterprise digital integrations offset demographic limitations on aggregate labor supply.
- — External trade route reconfigurations and global energy price volatility create transient spikes in transport components.